


Marc Chandler
My articles My offerMy siteAbout meMy videosMy books
Follow on:LinkedINTwitterSeeking AlphaAmazon
 Economists are often lampooned because of their inability to forecast changes in the business cycle. But the pandemic helped them overcome the challenge this time. A record contraction in Q2 was anticipated before in March. Similarly, economists generally expected the recovery after the March-April body blow. However, after an initial surge, some high-frequency data point a deceleration of the rebound.
That is what is important about next week’s economic reports. Businesses, investors, and policymakers get insight into how the economies are doing in the middle of Q3. For many large economies, there is a preliminary purchasing managers’ survey. One could be skeptical of projecting data from the first part of the month to the entire month, but the initial estimate is fairly good, and revisions tend to be minor. Many of the regional Federal Reserve branches conduct surveys of the manufacturing sector. New York (Empire State) and the Philadelphia Fed surveys also begin the monthly cycle of high-frequency economic reports.
The eurozone manufacturing PMI may have continued to recover, while the service PMI may not after a recent surge that lifted it to match its best level since March 2018 (54.7). The US composite PMI in July poked back above the 50 boom/bust level (50.3) for the first time since January. If the GDP trackers are fair (Atlanta Fed 26.2% Q3 or even the NY Fed’s 14.80% estimate), it would seem to point to a higher reading.
Investors may be particularly sensitive to weakness in August data, especially given that comments from several Fed officials seem to reflect high concerns about the economy, the stronger than expected July core retail sales and manufacturing output would suggest. Despite the disappointing manufacturing employment data (26k vs median forecast in the Bloomberg survey for 255k), the auto sector, along with residential construction, and housing activity more broadly, appear to be the sectors leading the recoveries in North America. Yet, one does not need to have a Ph.D. in economics to recognize that there will be an adverse impact from the loss of $600 a week in federal unemployment insurance for some 30 mln Americans were had been receiving it under the CARES Act.
The US presidential system and the current configuration has given rise to a set of circumstances that has seen fiscal support curtailed at the very same time the Federal Reserve has urged more effort. It seems to also confound political considerations that with an election around the corner, an agreement could not be struck. President Trump’s executive order that re-directs $44 bln of emergency relief funds to pay for a $300 a week unemployment insurance program provided they receive $100 a week in state benefits has not been launched yet.
Even if everyone who was getting $600 a week would get $300 a week, the impact on income and consumption will be palpable. Spending could fall by 15%-20%. However, the $100 in state benefits could exclude a million or more from the new Federal program, according to some estimates. Depending on eligibility, the funding may last 2-3 months.
The inability to agree to a new stimulus bill bodes ill for an agreement on the budget for the next fiscal year that begins October 1. The House has passed 10 appropriation bills and the Senate none. A continuing resolution, which extends the expenditure from the current year, is the logical step in these conditions. However, the divergence of positions is such that the odds of a government shutdown, despite the widespread economic hardship and pandemic, may be growing on the margin. As investors seek protection, volatility tends to rise. While bond and G7 currency volatility have increased this month, the VIX remains pinned in its trough just above 20.
Europe is more likely to extend its support programs, like the job furloughs, than pullback on fiscal support like the US. The parliamentary system avoids some of the distractions of the presidential system. Europe has taken three significant steps in the last couple of months: The ECB increased the size and duration of its Pandemic Emergency Purchase Program and lent over one trillion euros at a negative rate of minus 100 bp. The EU agreed to a 750 bln euro bond issuance that would be used to loans and grants in the next few years.
Of course, the economic historian Barry Eichengreen is undoubtedly correct when he notes that the issuance is around 5% of the marketable Treasury securities. That means that it would take them 20-year at that pace to offer a benchmark was deep and as broad as the US. The favorable outlook for the euro was in place for months before the EU’s Recovery Plan. Speculators, for example, in the futures market, have been net long the euro since March. They have been building it since then. Our own narrative gave more weight to the ECB’s actions than the EU. The premium Italy pays over Germany on 10-year borrowing fell by more than 100 bp since early May to return to pre-pandemic levels near 140 bp.
As the transmission mechanism of monetary policy began working, primed with cheap funds, the euro gained traction. One implication is that the rapid growth in the ECB’s balance sheet is not euro negative any more than the modest reduction in the Fed’s balance sheet is dollar support. Consider, as we have noted, that ECB’s balance sheet has risen by 755 bln euros (~$914.5 bln) in the eight weeks through August 7. The Fed’s balance sheet fell in six of the eight weeks through August 5, shrinking by roughly $255 bln. With last week’s advance, the euro has appreciated for the past eight consecutive weeks, the longest streak since 2004.
Obviously, the euro can appreciate without having to supplant the dollar as the numeraire in the world economy. After rallying roughly 10 cents from the middle of May through late July, the euro has been in a broad range for the last couple of weeks. Momentum indicators are trending lower as the euro moves sideways between roughly $1.17 and $1.1910-$1.1915. A 12-year trendline marks the highs.
The euro has also appreciated against the yen. It made new highs for the year last week near JPY126.750 to surpass the halfway mark of the three-year downtrend that took the euro from JPY137.5 to JPY114.40. The euro is in a trading range against sterling and has pared its earlier gains against eastern and central European currencies since the end of June.
There was a relative value trade here too. Surveys suggest that asset managers were underweight European equities, and they have, in fact, underperformed. Year-to-date, the S&P 500 is up by about 4.7%, while the Dow Jones Stoxx 600 is still off nearly 10%. However, here in August, Europe is barely edging out the US.
| The cross-currency basis swap often used to transfer liquidity from one currency to another, saw the euro trade for a premium for the first time in three months. This does not appear to be a signal or a reflection of the demand for dollars or euros. Instead, the shift to about a 25 bp premium for the euro over LIBOR appears to be the function of changes in Euribor, which is slipped below the risk-free Eonia benchmarks for the first time in 15 years. If the cross-currency basis swap is calculated using OIS (overnight index swaps), a small dollar premium remains.
The policy signals from Chinese officials give little reason to expect a decline in the Loan Prime Rate (one-year is at 3.85%, and the five-year is at 4.65%. The relatively high yield of China’s government bonds (10-year is a little below 3%) makes them attractive, especially for fund managers underweight China compared to benchmarks. SWIFT will also report the yuan’s share of its ubiquitous platform. As the chart here illustrates, the share of the yuan rose from 2011-2015 and has, for the past five years, moved sideways. It stood at 1.76% in June and averaged 1.80% in the H1 20 and 1.93% last year. The mere fact that it is discussed to in hundredths of a percent demonstrates its minor role. China has its own clearing and settlement platform, but it remains inconsequential from a macro vantage point, with CNY135.7 bln (~$19.4 bln) in 2019. The long-arm reach of the US and the significance of access to the dollar-funding market forces Chinese banks much to their chagrin to enforce Washington’s sanctions, including the latest on 11 officials from Hong Kong. The US has forced SWIFT cut access to Iranian banks, for example, and although the risk is low, that the US would sanction all Hong Kong or Chinese banks, the impact would be significant. |
CNY Swift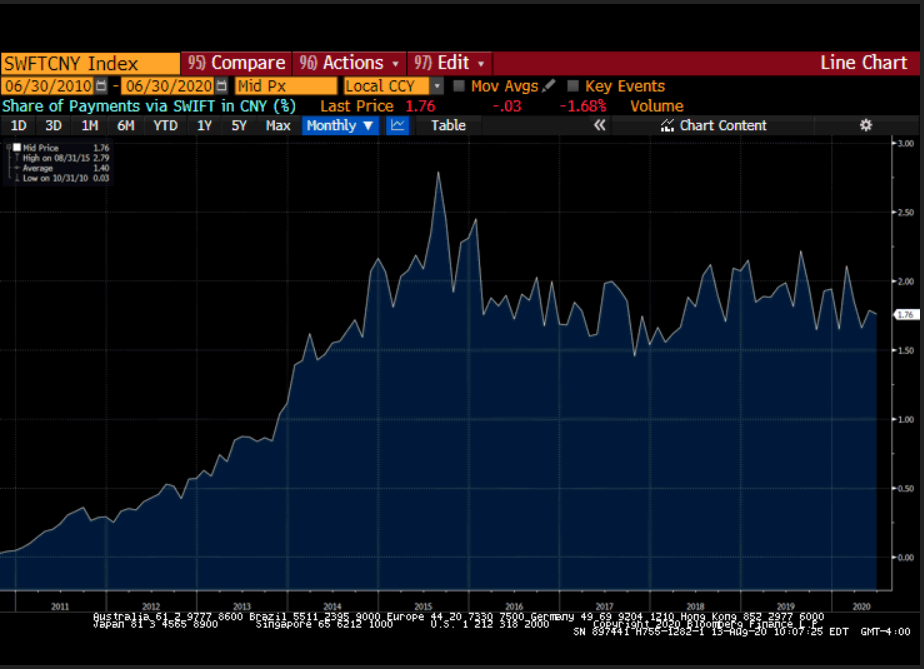 - Click to enlarge |
Chinese officials recognize that the international climate has turned more hostile. Beijing has unveiled a new slogan, “dual circulation,” to describe its strategy to build a stronger domestic economy while maintaining its role in global supply chains. This is still consistent with the import-substitution strategy the “Made in China 2025” that appears to have been toned down, and maybe even dropped altogether after provoking Washington. The “Dual Circulation” strategy will likely be enshrined in the new five-year plan expected to be unveiled in October.
After WWII, import-substitution strategies were regarded as the orthodoxy, but required large domestic markets and caused temporal dislocations (current account deficits) and stop-go policies. The success of Japan, and then followed by the Asian Tigers, demonstrated the success of export-oriented policies. The weak currencies that such strategies require became a source of friction with the US. China’s export strategy was disruptive, and its turn toward an import-substitution strategy spurs another kind of criticism. The problem is that China is both a large country and a poor country. GDP per capita is $10k. US GDP per capita is around 6.5x greater. Its sheer size makes it disruptive no matter what it does, and at that stage of development, has another country put the global good ahead of its national interests? If it had a parliamentary government, like South Korea or Japan, the challenges would be nearly as daunting.
Lastly, Turkey’s central bank meets on August 20. It was forced to abandon its ill-advised currency policy and the dollar briefly traded above TRY7.40 early in the week before the central bank began raising funding rates. TRY20 bln was offered at a one-month repo auction on August 13 that generated a yield of nearly 11%. The CBRT effectively closed the one-week repo facility earlier in August that had provided funds at 8.25%. The rate may be left on hold, but it is less relevant in the current environment.
Turkey has been the largest official buyer of gold this year (148 tons through May), but its need for liquidity has spurred it to open an auction for a three-month gold swap for lira. At $2000 an ounce, the 20 tons of gold is worth around $1.28 bln. Foreign investors continue to sell Turkish bonds and stocks ($700 mln in the week ending August 7 compared with average weekly sales this year of about $370 mln). The nearly 6.5% decline in the lira since the end of June, making it the worst-performing currency in the world, will erode investors’ interest in Turkish banks. The depreciation erodes capitalization ratios, and aggravate foreign liabilities. The banks have been marshaled to do the government’s bidding, and it leaves them with limited, genuinely safe, and liquid assets.
Full story here Are you the author?Tags: #USD,$CNY,$EUR,cross currency basis swap,Europe,Featured,federal-reserve,newsletter,Turkey