


Jeffrey P. Snider
My articles My offerMy siteAbout meMy videosMy books
Follow on:LinkedINTwitterSeeking Alpha
|
March 15 was when it all began to come down. Not the stock market; that had been in freefall already, beset by the rolling destruction of fire sale liquidations emanating out of the repo market (collateral side first). No matter what the Federal Reserve did or announced, there was no stopping the runaway devastation. It wasn’t until the middle of March that the first major shutdown orders began to appear – on Twitter feeds – and these weren’t the total lockdowns we’re stuck with now, either. |
 . |
| In Massachusetts, Governor Charlie Baker closed schools and started to prohibit gatherings of more than 25 people. In Ohio, Governor Mike DeWine somehow closed bars and restaurants. NYC’s mayor limited food service to take-out only.
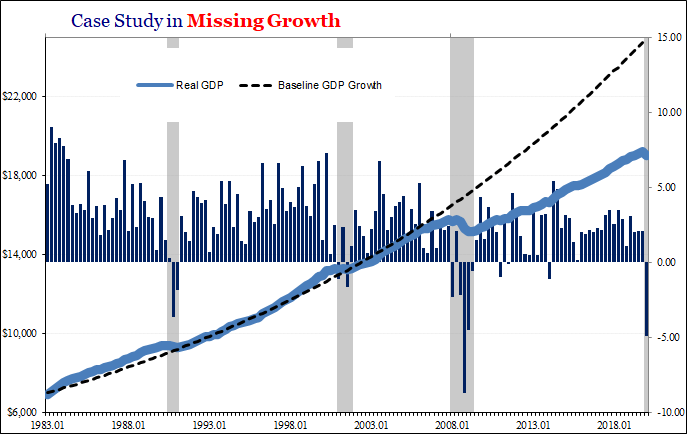
The full shelter-in-place or stay-at-home decrees would only show up at the very end of the month (a great many right at month-end, as well as in early April). That means for the overwhelming majority of the first quarter of 2020, it was business-as-usual. Except it was already highly unusual (see: aforementioned GFC2). The Bureau of Economic Analysis (BEA) has released its widely anticipated advance GDP report for Q1. Based on the data collected so far, last quarter’s economic output rivals the worst for any period in postwar history. Real GDP apparently fell at a 4.9% annual rate from Q4 2019. |
The Real GDP Problem, 1988-2018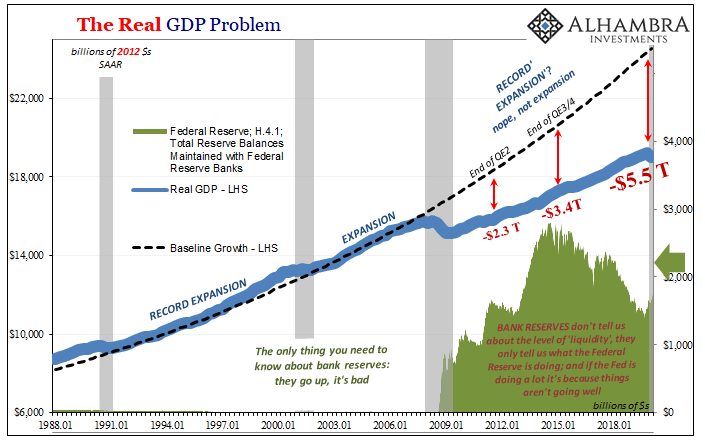 - Click to enlarge |
|
To put that in perspective, this much of a negative rate would’ve come in second for horrible during the Great “Recession.” Only Q4 2008 was worse, and that one unfolded with a global financial crisis at its beginning rather than this one striking at the end like now. Non-economic interruptions due to the pandemic response, sure. Fears over coronavirus, absolutely. But there’s more going on here than strictly what’s been presented by challenges containing the spread of COVID-19. The NBER hasn’t declared a recession yet, one which certainly began at some point during Q1. I don’t feel any such need to wait for these Economists before adding the gray bar to these charts. And that’s not even the most pressing concern; what we all are desperately seeking to figure out is how many quarters of gray there will eventually end up being. With Q1 in the books already at disaster levels, and we know there’s an even bigger one advancing in Q2. Two quarters of even epic-level recession (see: depression) would, however, be the best case. What if it leaks into Q3? Or, Heaven forbid, going further into Q4, leaving most or all of 2020 shaded gray? This is where I look not only to bond and money curves but also to the past. In using historical examples like the Great Depression, I do so not because that period in history is exactly like this one; rather, it can teach us something about the underlying proposition that is evident already. It’s not really about a potential banking crisis (which I judge to be of low probability in 2020) or even the prospect for a global dollar shortage sweeping across a hundred countries or more (a near certainty). Broadly speaking, what potentially unites 2020 with, say, 1930 is a single word that may not immediately spring to mind. |
Real Personal Consumption Expenditures, 1983-2019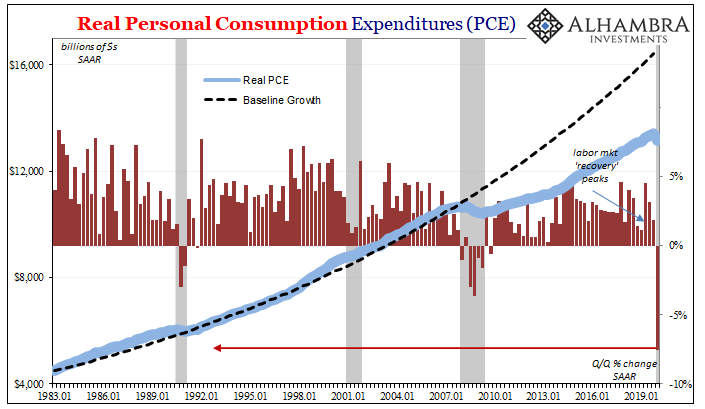 - Click to enlarge |
As I wrote last Friday:
What happened during the Great Collapse or Great Contraction 1929-33 was a fragile system unable to stem the tide of its own implosion. Part of the reason for it, and why it grew to be a near-total one, is that officials who put themselves in charge of keeping order didn’t understand their job and therefore what it would take to maintain order. They couldn’t see how delicate the circumstance; mistaking, at every twist and turn, the usual ebb in the otherwise contraction flow for their own success. Nothing marks those years in economic history quite like all the “expert” predictions for a “V.” Very reminiscent of 2008, too. When scouring the details of this GDP report that same root word continues to stand out. Keeping in mind what I wrote at the outset, mostly business-as-usual for Q1, the numbers keep adding up to frailty and fragility. Real Personal Consumption Expenditures (PCE) fell at nearly an 8% annual rate – and it’s even that much because of the Great Grocery Run of 2020 (spending on non-durable goods rose 5% Q/Q SAAR). As you can see above, there’s not much like this scale of contraction in the PCE series. The last comparable quarter was the second of 1980, a particularly nasty recession which featured double-digits in inflation as well as interest rates. What made this situation so questionable to begin with was Euro$ #4. In other words, the economy was already in trouble, pretty serious trouble long before arriving mid-March. |
Real Private Non-residential Fixed Investment, 2002-2020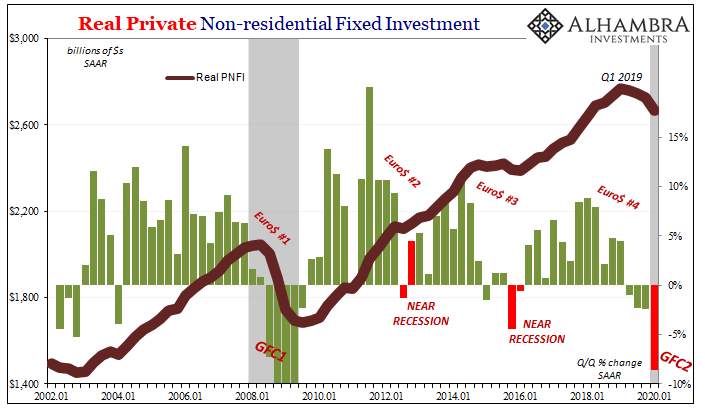 - Click to enlarge |
| While politicians and central bankers were counting on imaginary economic strength to help cushion the non-economic blow, very real weakness had already set in and was absolutely amplified by market chaos first.
As we’ve already seen in the labor statistics, the labor force participation as much as jobless claims, at the first sign of danger the whole damn system folded like a cheap suit. It didn’t stand up as long as it could, as was expected, it just buckled – money to finance to economy. Just like a GFC. |
Real Private Non-residential Fixed Investment, 2002-2020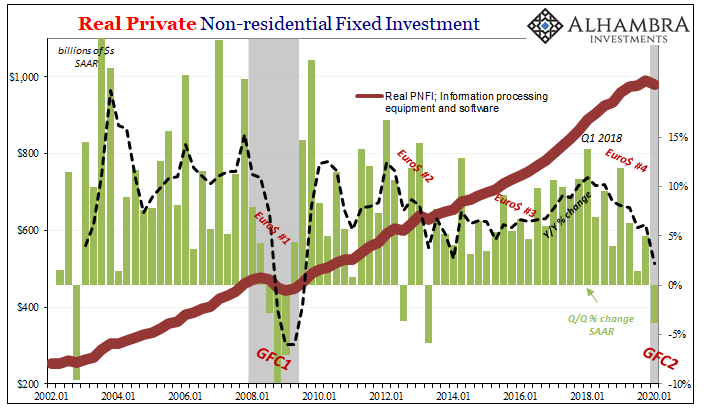 - Click to enlarge |
|
We look to components like business investment (capex) which aptly demonstrated the negative trends underneath the economy all throughout 2019 (as noted yesterday, the bond market really nailed that one). More ominous still, we’ve not yet seen the really big disaster in this crucial piece of the economic puzzle. Including, importantly, inventory. |
Case Study in Inventory Cycles, 2006-2020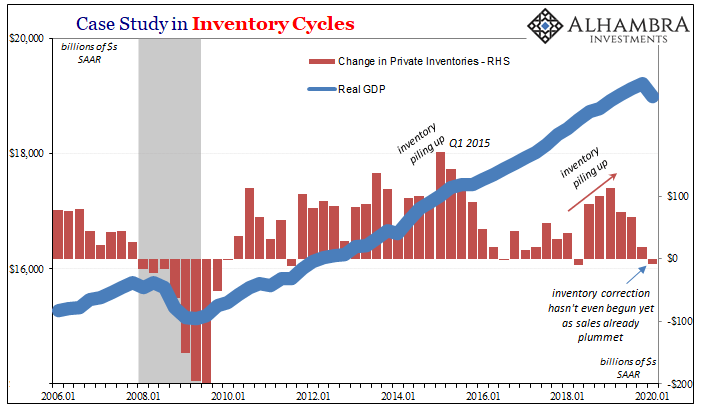 - Click to enlarge |
|
According to the BEA’s numbers, the change in Private Inventories was just -$9.3 billion, a tiny move. Though I wouldn’t be surprised if this inventory estimate gets revised downward over the coming months, it’s still nothing like the end stage of an inventory cycle when discounting (the deflationary mechanism) and merchandise liquidations are required to rebalance past production with current depressed levels of sales. I mentioned yesterday this disturbing discrepancy, and the BEA confirms the economy must still be at the front of it. And that will drag out economic weakness further into the future. |
GDP Net Trade, 1998-2020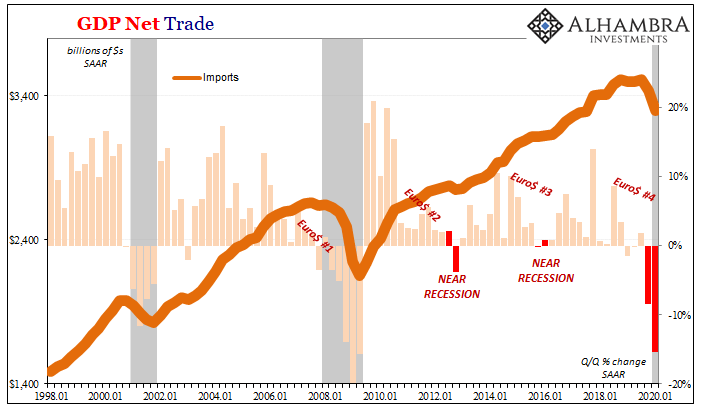 - Click to enlarge |
|
There are so many other GDP components that we could review here, but at this point the point has been made. Weakness at the start, a key element in order to appreciate where we are now and where we can realistically go from here. |
GDP Net Trade, 1998-2020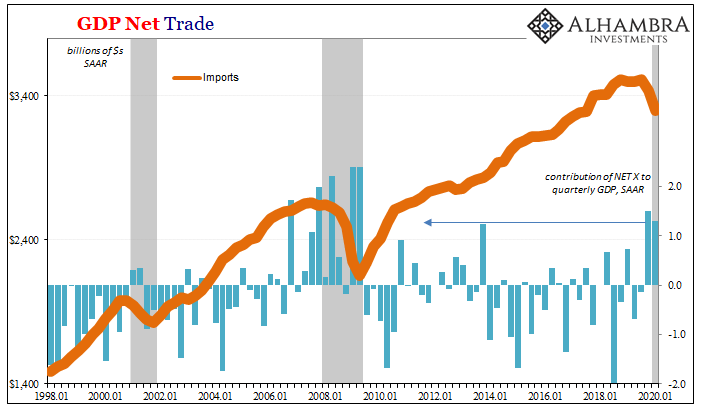 - Click to enlarge |
|
This was a fragile economy that like its fragile monetary system is not holding up. That’s why at each and every one of these initial reviews and statistical releases, it’s far and away below expectations. “Consensus” has been derived from Jay Powell’s strong economy nonsense. That’s ultimately what sunk the world in the early 1930’s. Bank panics and problems with the worldwide redistribution of gold, yes, but those things predicated upon a fragile situation that couldn’t bear the strain of never being fixed.
What I’m getting at is that with these huge signs of frailty all around, are there really any reasonable means to expect a “V”-shaped recovery from here? Furthermore, to be led to believe that it is the Fed, of all things, which is going to ensure this perfect outcome. Jay Powell would have a better shot printing suitcases. Why suitcases? Because unlike Greenspan’s empty bowl, a closed suitcase could plausibly hold some actual cash à la Tampa 1929. |
 |
Full story here Are you the author?
Tags: capex,currencies,economy,Federal Reserve/Monetary Policy,GDP,GFC1,GFC2,global trade,Great Depression,Great Recession,imports,Markets,Monetary Policy,newsletter,PCE,personal consumption expenditures,stimulus