


Jeffrey P. Snider
My articles My offerMy siteAbout meMy videosMy books
Follow on:LinkedINTwitterSeeking Alpha
| March ended up being a pretty wild ride. Lost amidst the furor over Russia’s invasion of Ukraine, the month began with a couple clear “collateral days. T-bill rates along with repo fails echoed that same shortfall before the yield curve then joined the eurodollar futures curve being inverted. It really hasn’t been the same since.
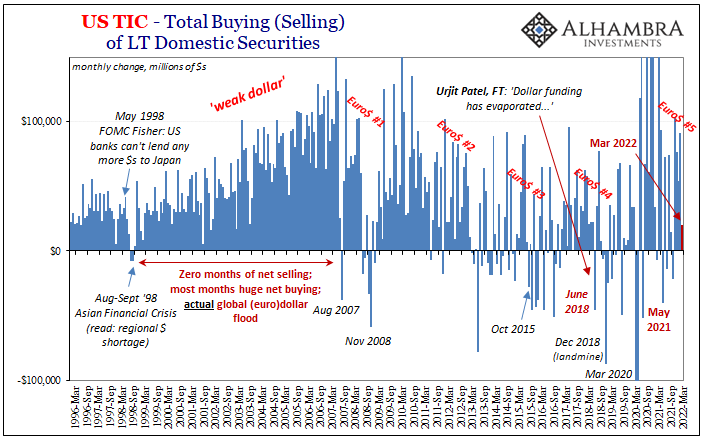
Looking back on it using the updated TIC data for that volatile month, it shows the usual behavior consistent with a Euro$ #5 hitting its next step. Start with the raw data itself, the gross buys versus sales. You can see the dysfunction from nothing more than unusually heightened churn; as had certainly been the case for March 2022. |
 . |
 . |
|
| This level of dollar strain is going to affect foreigners’ collective ability to continue buying US$ denominated assets, as it did. The total net buying for the month decelerated to just +$20.2 billion, the lowest since last October (when curves previously shifted).And while that was still a positive number, there was a great deal of churn within it, too, especially on the private side. According to Treasury’s TIC, private foreigners sold a massive amount of US equities ($91 billion) and used the proceeds to buy, get this, US Treasuries ($81 billion). Collateral? Flight to safety? |
 . |
 . |
|
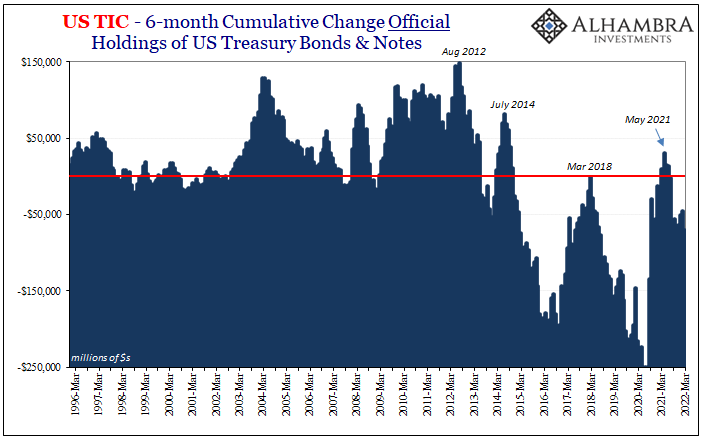
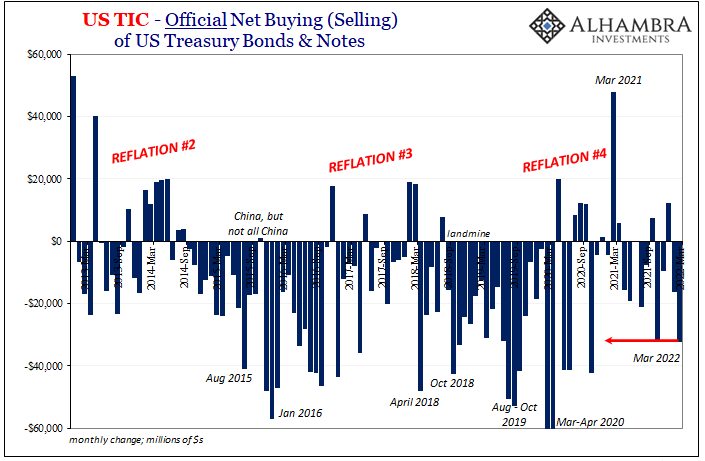
| On the other side of the ledger, foreign officials (FOI) were forced to use (sell) theirs. As is typically the case, dollar shortages leave officials to scramble and mobilize their securities reserves and that was no different in March. In fact, FOI selling (net) during the month was the most since November 2020.Among the primary sellers, one you’d expect and the other maybe not. The former, obviously, China given the downward leg in CNY that had just begun during this time, TIC shows us that, once more, rather than “devaluation”, CNY down is Euro$ #5 growing more troublesome for the Chinese. Mainland holdings of USTs declined by more than $15 billion, only $6 billion of which appears to have been shifted to Belgium. |
 . |
 . |
|
| The latter big March UST seller was Japan, actually. This is unexpected only in how Japanese official holdings are almost always uncorrelated with dollar woes (or reflation). The Bank of Japan usually just lets Japanese banks fend for themselves, to work it out on their own.In this case, however, JPY down big seems to have triggered some kind of response. Reported holdings of USTs by Japan declined by a whopping $73.9 billion in that one chaotic month.
Trying to piece together some sort of correlation from among these international (euro)dollar variables is difficult when they come in and out of Tokyo. |
 . |
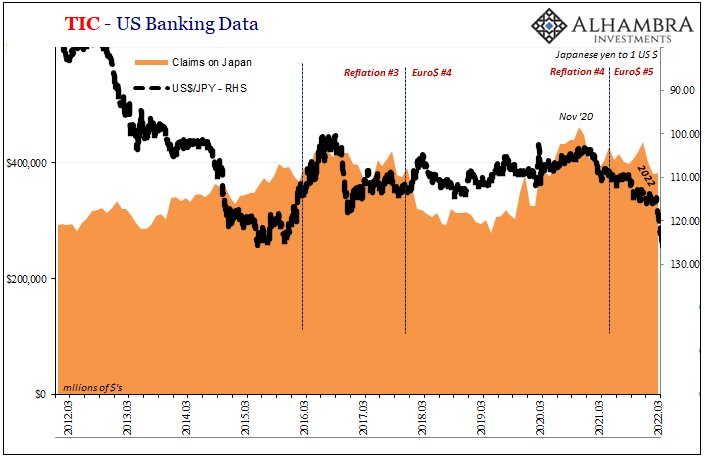
| Whereas it’s pretty easy and clear CNY to China USTs (once you include Belgium), there’s only a partial and fuzzy relationship visible between JPY (and only since 2017) and something like US bank claims on Japanese banks.
Hardly overwhelming, the post-November 2020 drop in implied eurodollar redistribution does correspond to some degree with JPY’s downward turn. US bank claims really turned lower in January, and then it would take until March before the yen turned much lower (and Japan sold all those USTs), as well. |
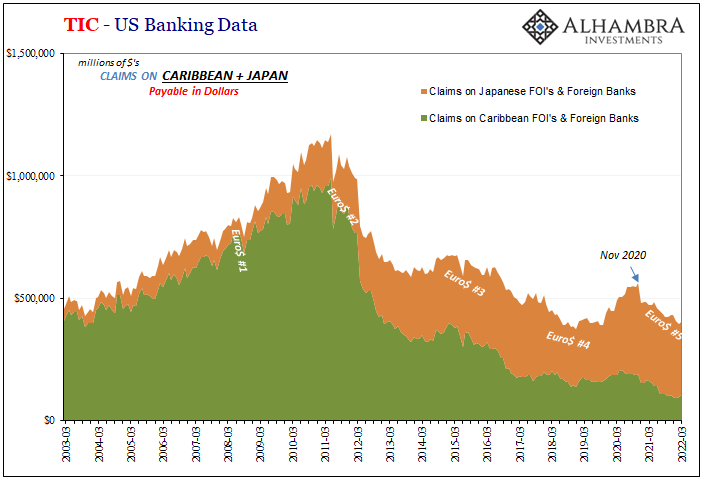 . |
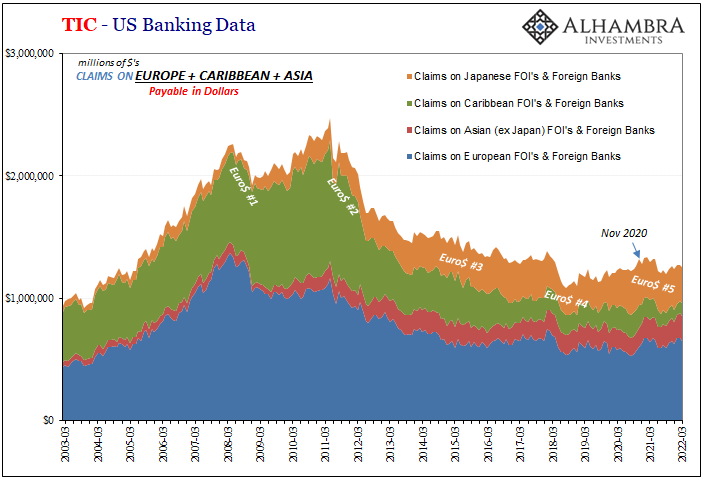
Apart from lower US bank claims on Japan, claims on European counterparties declined sharply in March, too, while those on firms in the Caribbean were somewhat lower. These three large redistribution points were doing a lot less US dollar business with American banks, then perhaps leaving it up to FOI’s to fill in these gaps even if, as usual, not completely.
Just starting with the gross TIC totals, there’s plenty which indicates March as the tumultuous time we’d experienced as it unfolded. Far from a complete disaster, system performance needn’t have been; instead, just another month of further escalation consistent with everything we already knew.
With all of these things getting worse in April, especially CNY together with JPY and the US$ in general, with the yield curve un-inverting and re-inverting, we’ll see if next month’s TIC can bring more of it into clearer focus in greater detail. Given where everything stands so far in May, and what we already know from March, markets and TIC, that may not really matter apart from academics.
Full story here Are you the author?Tags: Bonds,currencies,economy,EuroDollar,eurodollar system,Europe,Featured,Federal Reserve/Monetary Policy,Japan,Markets,newsletter,tic,U.S. Treasuries