


Jeffrey P. Snider
My articles My offerMy siteAbout meMy videosMy books
Follow on:LinkedINTwitterSeeking Alpha
|
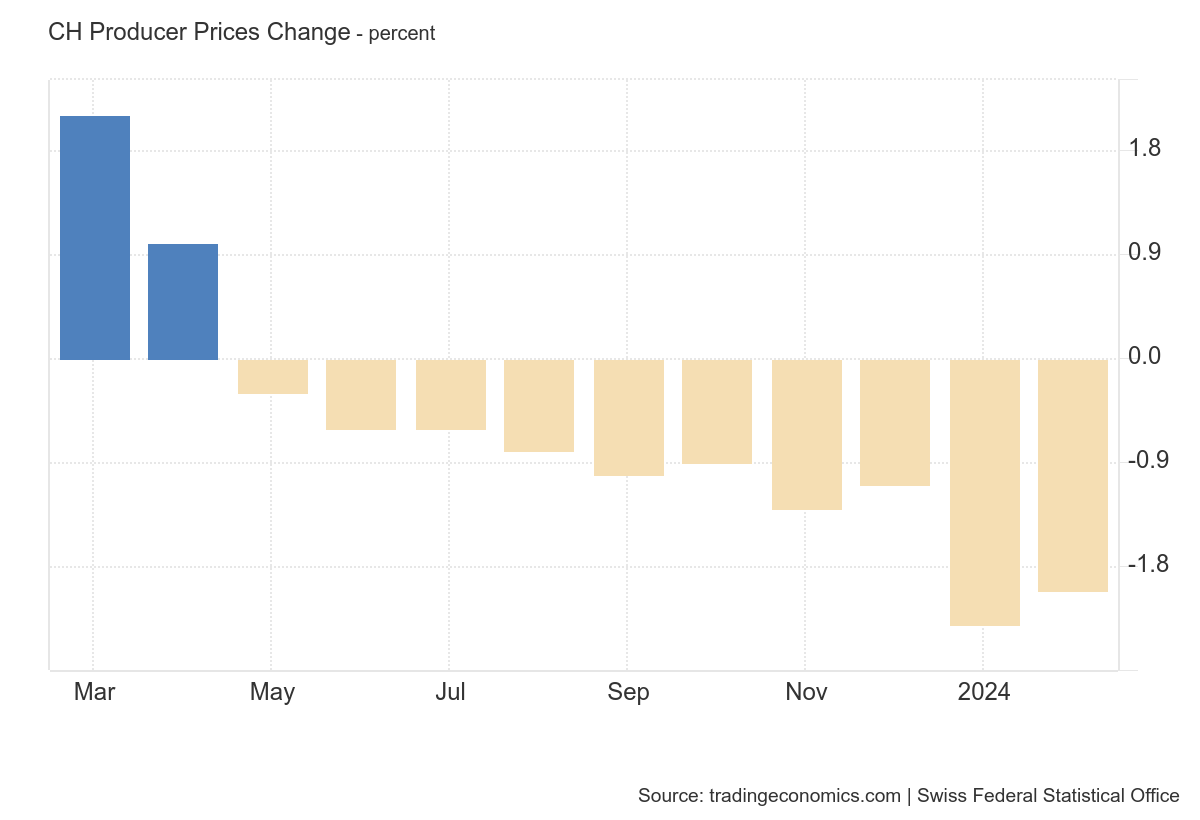
There it was sticking out like a sore thumb right in the middle of what should have been the glory year. Everything seemed to be going just right for once, success so close you could almost feel it. Well, “they” could. The year was 2014 and the unemployment rate in the US was tumbling, the result of the “best jobs market in decades.” Real GDP in that year’s two middle quarters was pretty near 5% in both. What wasn’t to like? As GDP-measured output was spiking, so, too, had repo fails. There were other uneasy developments that year, as well, mostly tied to CNY’s sudden reverse, but repo fails was a big one. Not the least of which was because by every mainstream account it should not have happened. There were two QE’s ongoing at the time, though tapered in their pace. The common perceptions of accelerating global growth and therefore harmony, low risk pairing up with great opportunity. A major liquidity warning right in the heart of it? According to FRBNY, primary dealers had reported around $100 to $120 billion in repo fails regularly all year up until June. There was one week in March, the exact same time the PBOC was doing things, I will point out again, when the total (“to receive” plus “to deliver”) nearly registered $200 billion. By and large, though, the repo market seemed quite calm. |
US Treasury, 2010-2019 - Click to enlarge |
| For specific reasons we will probably never know, the second week in June repo fails jumped to $388 billion. The following week, a little more than $400 billion. There was still more than $300 billion to close out the month.
The very next week, beginning with July 2014, the dollar launched its stunning climb and oil prices their plummet. Euro$ #3 was in full bloom all the while “the best jobs market in decades” wrongly set everyone’s expectations for 2015 and beyond. The repo fails swarm had already canceled them. That’s what these things are – they aren’t steady periods of continuously elevated failures in collateral mechanics. They come up as these discrete swarms of them, multi-week surges that denote serious disruptions to normal functions. Collateral, mainly. As a swarm, though, as quick as they show up even quicker sometimes they just disappear. The financial system is derailed even when they are no longer in view. The repo market is a fickle one, its signals often frustratingly finnicky. The true nature of shadow money. |
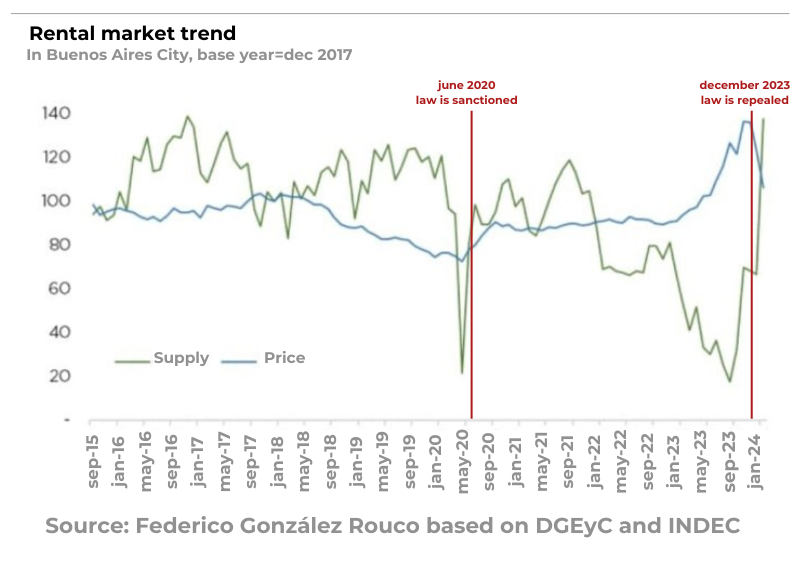
US Treasury , 2017-2019 - Click to enlarge |
| Beginning in early March 2019, suddenly a small fail swarm which the week following its end (March 20) saw quite a lot of negative changes all throughout financial markets. Not only did EFF move above IOER, swap spreads began compressing and, as illustrated above, a sharp dive in bond yields; the first of several.
This year’s mid-year fails swarm began like 2014 in June but unlike then it kept up all the way until the last week of August, first week of September. A sharp spike the week of September 4 punctuated what had been serious enough concerns that even the “strong” economy mainstream was talking non-stop about recession and the like. It was that disruptive. Where we are now, of course, is the green arrow pictured above. Problems with repo collateral at least as it may be in reported fails (by primary dealers) backed way off and suddenly the world seems a much brighter place. Bond yields have backed up and the once-constant whispers of recession have been replaced by huge sighs of relief. Are those calming bits of exhalations really warranted? |
US Index Futures, 2017-2019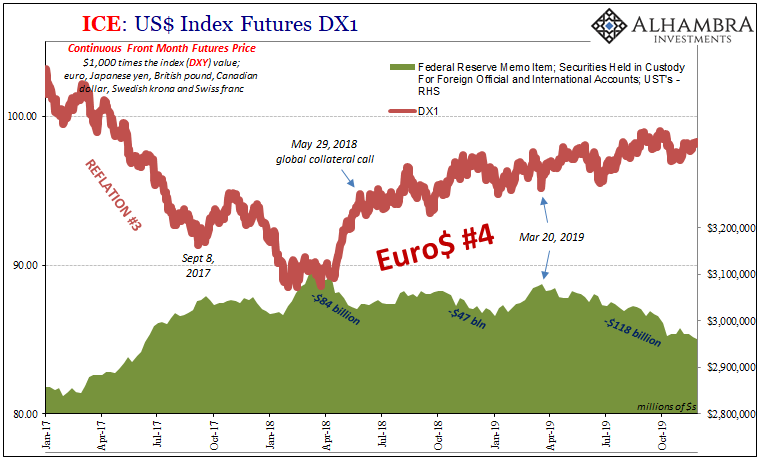 - Click to enlarge |
| That’s what everyone really wants to know. Though much less urgent and immediate, there remains considerable uneasiness. Though yields have gone back up, they haven’t moved by all that much. Even I am a little surprised by how they’ve behaved in what I think is this midpoint (recreating, perhaps, the 2011-12 midpoint when it was more reasonable to characterize yields during that time as having stopped falling than actually rising).
If this is a midpoint, then there must be signs elsewhere maybe even in terms of collateral if not specifically fails. One of those I have kept my eye on is a little-noticed corner of the Fed’s reporting regime. In the name of some foreign relations, overseas central banks and occasionally large offshore commercial traders doing regular business, the US central bank custodies US$ assets on their behalf. Mostly US Treasuries, as you would expect. The total amount is substantial, about $3 trillion give or take. What we find over time, however, is that the balance kept on custody for these foreign firms and agents tends to rise and fall with reflation and its opposite. When “dollars” are more plentiful because the eurodollar system may be modestly expanding (or not outright harmfully constrictive), more UST’s end up in foreign hands on account with the Fed. And when those same “dollars” begin to disappear again, the dollar rising and fails swarming in repo, they disappear from the Federal Reserve’s accounting. As you can see above, it pretty much lines up with the changing trend in DXY, meaning the dollar’s broad exchange value (another one of our key global dollar liquidity indications). |
Collateral & Implied Bank Capacity, 2016-2019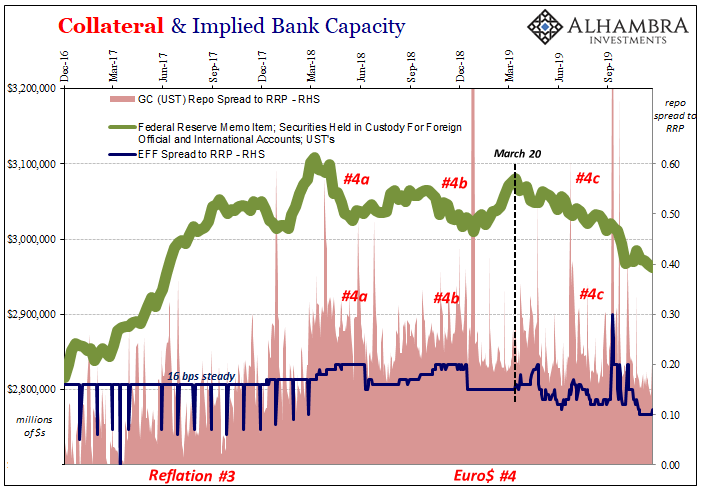 - Click to enlarge |
| Sure enough, going back to March 20, just following the first repo fails swarm of the T-bill deluge era, UST’s have been consistently leaking out of these visible foreign hands.
That decline actually accelerated in the wake of September’s dress rehearsal-type repo rumble. So, while fails scaled back and things have looked somewhat better, this one key indication did not and does not. What’s more, the UST’s have gone missing again starting toward the end of October – as swap spreads have compressed a little and even a slight upward move in fails during the latest week of data (the week of November 20). That’s not all; T-bills! What we think might be happening is dealers hoarding collateral. The mainstream still talks about the situation as if there are “too many” UST’s despite the debunking in UST prices, but what really happens is dealers hold on to UST’s for their own reasons or purposes which deprives the rest of the market of its more fluid collateral operation. For foreign offshore repo participants seeking collateral, if you can’t borrow or transform from primary dealers who choose to hoard it, where might you go instead to obtain the required pristine securities? |
Primary Dealers Net UST Positions, 2014-2019 - Click to enlarge |
| Your local central bank might be willing to help especially if it holds quite a few already, which answers in part why Treasuries tend to leak out of the Fed’s custody during these same periods.
What’s interesting about dealer holdings over the last several years is their stock of T-bills – or, more accurately, the changes in that stock. Again, we are told dealers are holding more because they can’t sell them. Hogwash. Pure BS. |
Primary Dealers Net UST Positions, 2014-2019 - Click to enlarge |
| They do, in fact, sell them and did not that long ago. You can see the build-up of bills in dealers reported (net) positions beginning in early 2018 along with the change in the Fed’s reported custody holdings on behalf of foreign agents.
May 29, 2018, falls right in that early period, as does DXY’s 2018 resurrection (but no fails swarm). When dealers hold more bills, bad things tend to follow. While that last part of the fails swarm in 2019 was taking place, dealers had been actually “selling” out of T-bills like we hadn’t seen since 2011. The premium on bills as collateral finally rose high enough for them to be de-hoarded? What followed a little later was this midpoint, the end of the last swarm. Going back to the middle of October, as you can see above, banks have started to hoard bills again and like they are becoming some endangered species. Dealer (net) holdings of bills skyrocketed to more than $42 billion the week of November 13 and more than $45 billion in the latest figures (again, the week of November 20). That’s the second highest number (last December during the landmine being slightly higher) of them in many years. |
Swap Spreads, 2018-2019 - Click to enlarge |
One reason why dealers might think bills could be in short supply? The small-scale asset purchase of Not-QE which will target, and has already targeted, bills exclusively (though others will push the conspiracy charge, that these banks are just front-running the Fed’s buying program again even though the history of the last decade runs contrary to that view).
I don’t think Not-QE is the only reason dealers have backed up the truck for T-bills.
For all the talk and assurances about recession risk fading meaning overall more positive perceptions, nothing really has changed. Certainly not recent economic data around the world. There remains the same vulnerabilities and potential bottlenecks should the (global) downside case be further imposed more than it already has. UST’s have continued to leave Fed custody.
There are considerable indications that the last fails swarm wasn’t the final answer for Euro$ #4. That’s not unusual; they are swarms, after all. The Fed was highly successful with its repo program, just not in any way that relates to effective liquidity and monetary function. The central bank is effective only at PR, which just means that it got everyone to stop paying attention to repo even though there remains a lot which absolutely still requires it.
Full story here Are you the author?
Tags: Bonds,collateral,currencies,economy,Federal Reserve/Monetary Policy,Markets,newsletter,Primary dealers,repo,repo fails,swap spreads,U.S. Treasuries