


Jeffrey P. Snider
My articles My offerMy siteAbout meMy videosMy books
Follow on:LinkedINTwitterSeeking Alpha
| The US economic data begins to trickle in slowly. Today, the reopened Census Bureau reports on orders and shipments to and from US factories dating back to last November. New orders for durable goods rose just 4.5% year-over-year in that month, while shipments gained 4.7%. The 6-month average for new orders was in November pulled down to just 6.6%, the lowest since September 2017 (hurricanes). |
Durable Goods New Orders, NSA 1993-2018(see more posts on U.S. Durable Goods Orders, )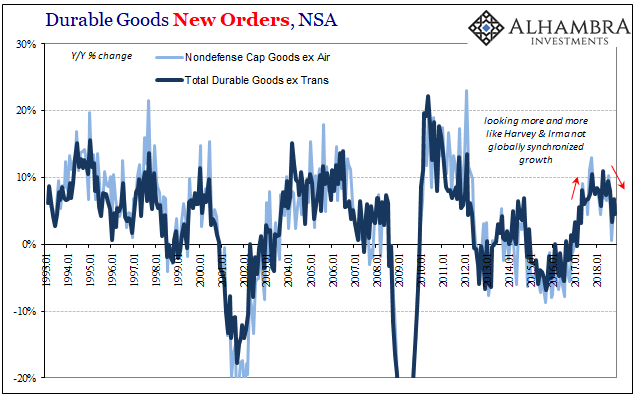 - Click to enlarge |
| Even though the data is several months behind, it shows very clearly the state of the goods economy just prior to the market “fluctuations” that ended last year. Whatever economic momentum there may have been in late 2017 (for whatever weather reasons) and early 2018 (for whatever political reasons), the last half of last year was without any.
Seasonally-adjusted, durables orders are down about 0.5% since August – a three-month losing streak (and counting). Over the last seven months of current data, this forward-looking indicator has been flat; no growth at all. |
Durable Goods New Orders, SA 2013-2018(see more posts on U.S. Durable Goods Orders, )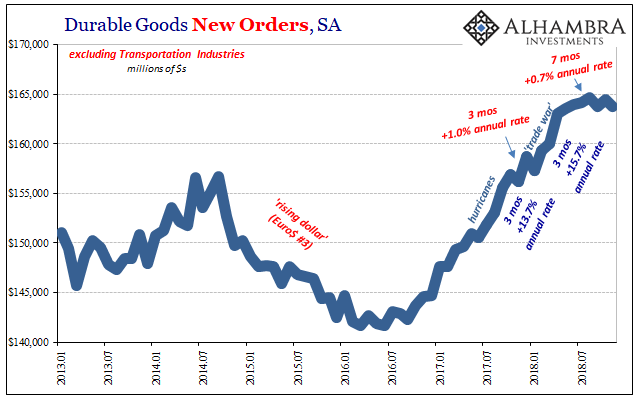 - Click to enlarge |
| A few months without any gains can be related to a number of possible factors including weather (and I’m pretty sure the Polar Vortex of January 2019 will be a heavily cited influence in economic analysis just ahead), but seven months or more than half a year is an extended growth vacation that can’t be so easily dismissed.
That’s particularly true given that the same struggle is being picked up beyond the durables sector. The Census Bureau today also updated figures for overall factory orders; the level of activity in all manufacturing industries, both durable and nondurable goods. |
All Manufacturing Industries New Orders 1993-2018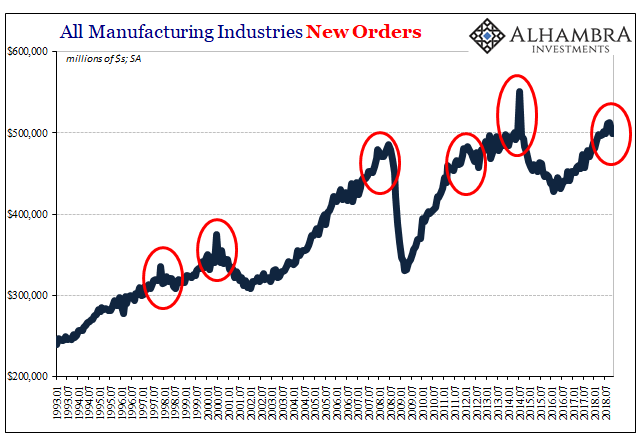 - Click to enlarge |
| Factory orders had surged in August and September last year, some of which related to aircraft orders handed to Boeing. In October and November, they sank back so that factory demand was lower in November 2018 than it was in June 2018.
Furthermore, this sort of behavior has marked each and every economic inflection since the data series was begun in 1992. From the Asian flu downturn, to the dot-com recession, and then the three completed eurodollar squeezes (so far), for some reason there is a rush to get in factory orders (aircraft and nondurables) prior to the economy in general falling off. |
All Manufacturing Industries New Orders 2012-2018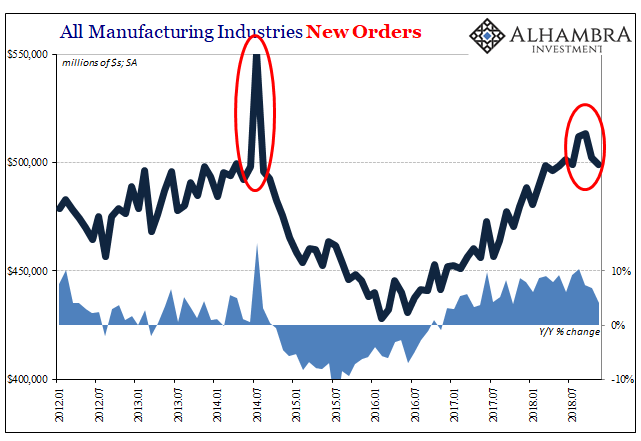 - Click to enlarge |
| It’s obviously too early to declare the same process at work recently, the beginning of the economic downside in the US. However, given the end-of-year economic statistics for other places around the world plus market chaos around the same time, it isn’t so far out of the realm of possibilities as the mainstream, unemployment narrative had made it appear.
This is all predicated on the current estimates holding up given looming benchmark reassessments working their way into the numbers. It may be, and I suspect it will be, the original runs were biased upward by overaggressive trend-cycle setting in the statistical processes that turn initial panel data into smoothed and polished seasonally-adjusted data series. |
Durable Goods New Orders, SA 2006-2018(see more posts on U.S. Durable Goods Orders, )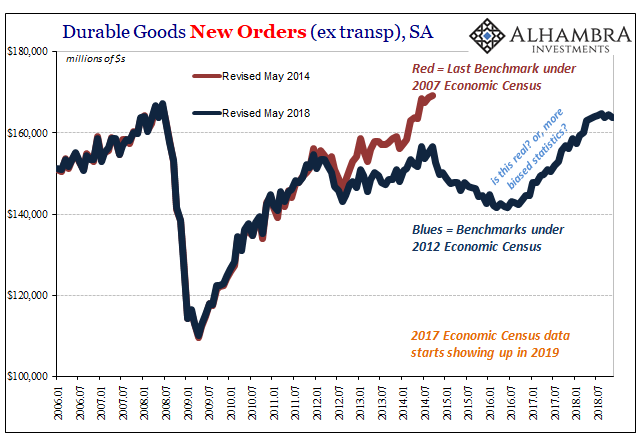 - Click to enlarge |
| There are questions, therefore, about just how much “boom” there may have been in the US economy during 2017 and Reflation #3 perhaps in the same way and to the same scale as there were questions about 2014 and Reflation #2. Add that to the potential economic inflection perhaps showing up in the goods economy, and it comes out in both “muted” inflation expectations as well as Federal Reserve Chairman Powell turning chicken hawk in a matter of weeks.
We already know Europe and China are in trouble; Japan, too. The US economy potentially rolling over, that’s going to make the situation worse. Rolling over from a lower height than otherwise believed, this would sound a lot like December. |
Eurodollar Futures Curve 2019-2024(see more posts on EUR/USD, )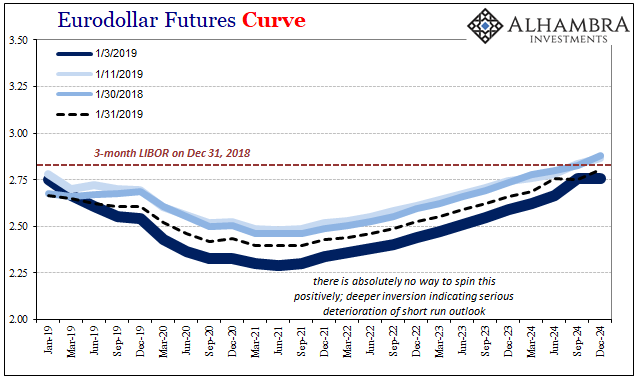 - Click to enlarge |
Tags: currencies,downturn,durable goods,economy,EUR/USD,factory orders,Federal Reserve/Monetary Policy,manufacturing,Markets,new orders,newsletter,U.S. Durable Goods Orders