


Jeffrey P. Snider
My articles My offerMy siteAbout meMy videosMy books
Follow on:LinkedINTwitterSeeking Alpha
| Over the past month, crude prices have been pinned in a range $50 to the high side and ~$46 at the low. In the futures market, the price of crude is usually set by the money managers (how net long they shift). As discussed before, there have been notable exceptions to this paradigm including some big ones this year.
It was earlier in February when money managers piled in to WTI longs, apparently expecting better things from “reflation.” It was perceived as such a sure thing that by the week of February 21the market was stretched at a record to that side. Oil prices did not follow, however, and then began to slide as managers rethought what might really be going on. |
Crude Oil, Jan 2006 - Jun 2017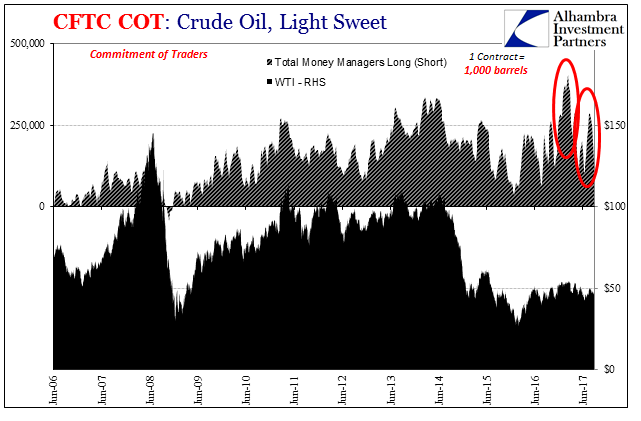 - Click to enlarge |
| It happened again more recently though to a lesser extent. Triggered by copper, Draghi’s BOND ROUT!!!, or RMB (or some combination plus inventory drawdowns), money managers crowded long again in July. Still oil prices did not follow by all that much, staying at best in the range and often contradictorily with a downside bias. |
Crude Oil, Jun 2014 - 2017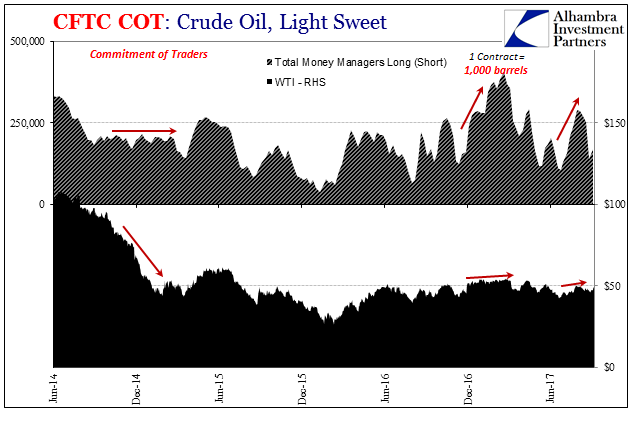 - Click to enlarge |
| The reason was ironically the producer segment. The very players this market was meant to serve have since February used far less of it. |
Crude Oil, Jun 2014 - 2017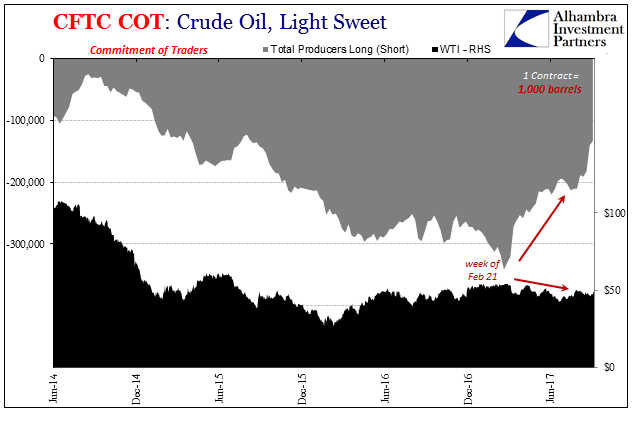 - Click to enlarge |
| They have literally fewer reasons to do so, as the need to short WTI in the futures market follows closely domestic crude inventory levels. |
Crude Oil, Jun 2014 - 2017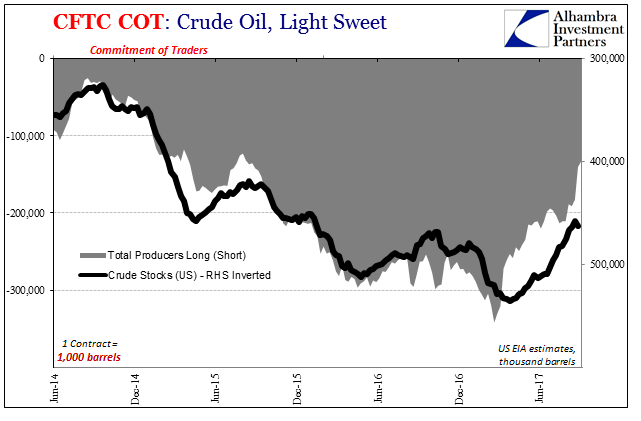 - Click to enlarge |
| It has negated all that money manager enthusiasm; twice. Over the past month, inventories have continued to decline (though in the first week of September they rose likely as a hurricane effect), as has the aggregate net short position of producers. Money managers have become much less enthusiastic again, positioning oil futures market overall more pessimistically.
The difference isn’t all that large, however, with both dealers and “others” taking up some of the slack. That may account for the relatively narrow range in which WTI has traded since early August. The futures market during that time was mostly balanced if slightly more to the downside (indicated for price). |
Crude Oil, Jun 2006 - 2017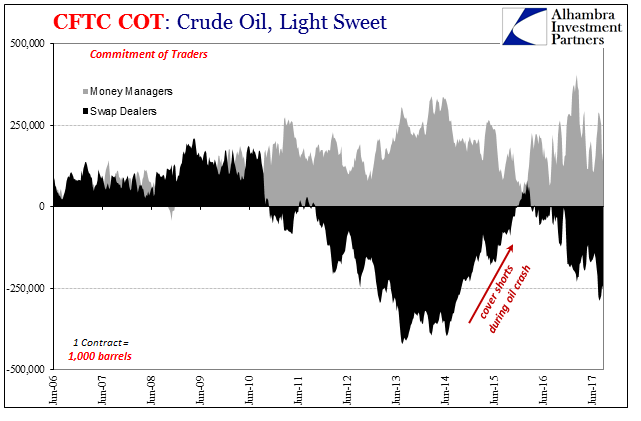 - Click to enlarge |
| The changes in the UST futures market was perhaps a little more interesting. For a few weeks after Mario Draghi’s late June comments the market seemed to have shifted to a negative UST bias (more net long, indicating counterintuitively lower UST prices). It was only a temporary change, however. |
US Treasury Bond Futures, Jan 1993 - 2017(see more posts on U.S. Treasuries, )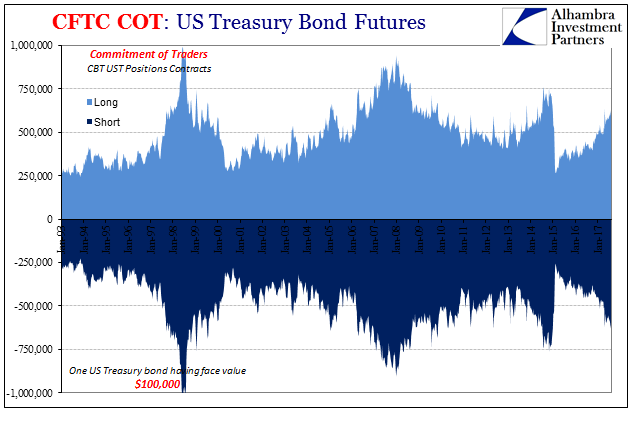 - Click to enlarge |
| By mid-July, the futures market balance had moved back in the anti-“reflation” direction which overall continues to be indicated. |
US Treasury Bond Futures, Jan 2010 - 2017(see more posts on U.S. Treasuries, )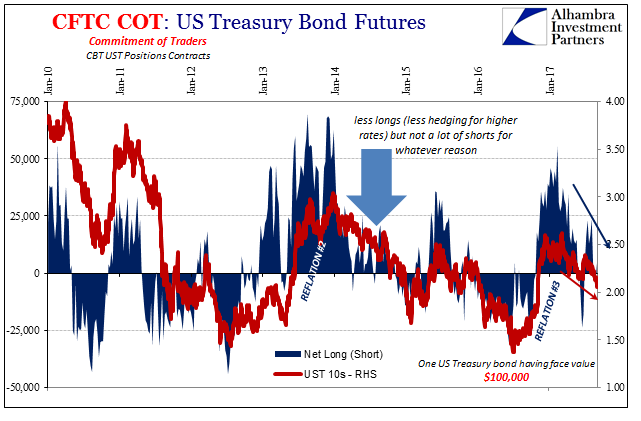 - Click to enlarge |
| When we examine the breakdown, it was the commercial side almost exclusively that reacted to Draghi (or whatever) in late June. Non-commercial specs moved a little but not much off their still growing net long position. |
US Treasury Bond Futures, Jul 2016 - 2017(see more posts on U.S. Treasuries, )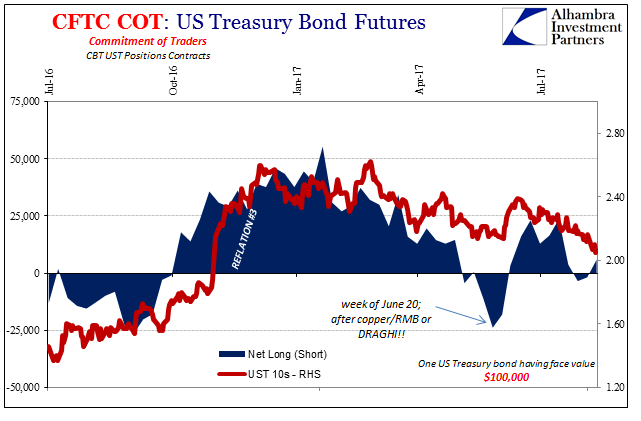 - Click to enlarge |
| Fewer commercial shorts for those weeks meant the balance shifted net long and negative for UST prices (the BOND ROUT!!! was on with hedging any long positions becoming, at the margins, relatively more difficult and/or pricey). |
US Treasury Bond Futures, Jul 2016 - 2017(see more posts on U.S. Treasuries, )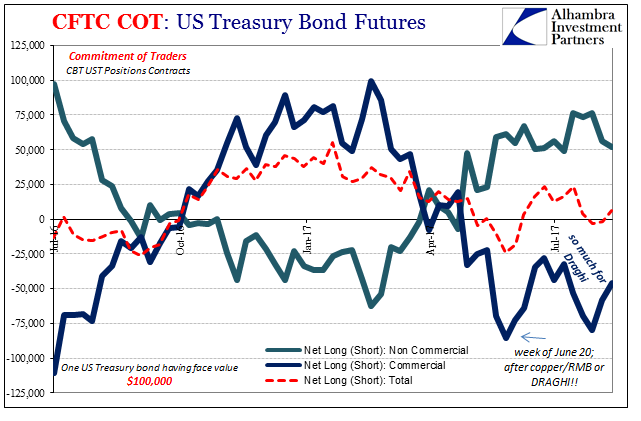 - Click to enlarge |
| The yield on the 10-year note actually moved lower again as the commercials stopped covering their shorts. They didn’t write a whole lot of new ones until this most recent downturn in yields (higher UST prices). The question is why commercials were spooked by Draghi (or whatever) in a way that specs weren’t.
|
Benchmark 10 Year UST, Jul 2016 - Sep 2017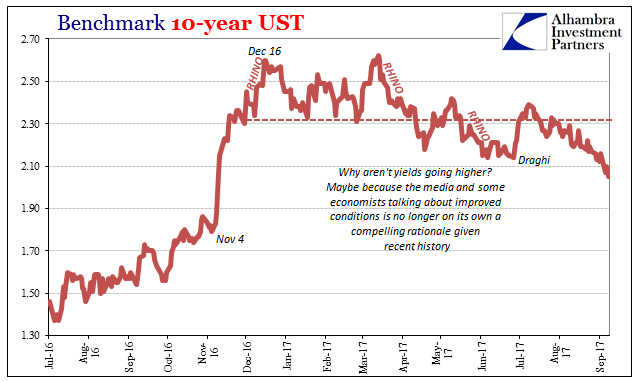 - Click to enlarge |
| As you can see on the far right side of the chart immediately above, the pattern has repeated – though this time without any BOND ROUT!!!, quite the opposite actually. The comms are covering, while even the specs are, too (though, again, to a smaller degree). And yet, UST yields dropped considerably to new anti-“reflation” lows last week. That might propose some extra buying interest in cash markets? Maybe due to monetary tightness unrelated to FOMC policy? |
US Treasury, Jan 2017 - Sep 2017(see more posts on U.S. Treasuries, )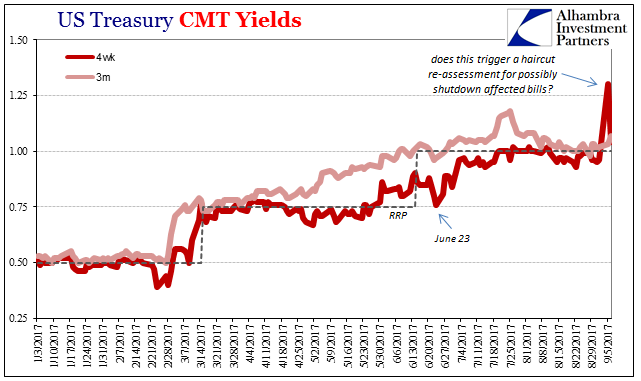 - Click to enlarge |
| Unfortunately, the COT report doesn’t give us anywhere close to that level of precision. What it does suggest is that commercials have an itchy trigger, more unsteady about the fall in rates this year. That isn’t actually surprising, as commercials are almost always less sure of their positions (comes with the territory of being a dealer, listening to economists and policymakers perhaps more closely than is ever warranted).
That leaves the non-comms as calling BS on the mainstream idea of interest rates having nowhere to go but up. In both of the two deepest and most vital markets (the other being eurodollar futures) there is relative agreement about what is really going on, and it isn’t tremendous money opportunity right around the corner. |
US Treasury Bond Futures, Jan 2013 - Jun 2017(see more posts on U.S. Treasuries, )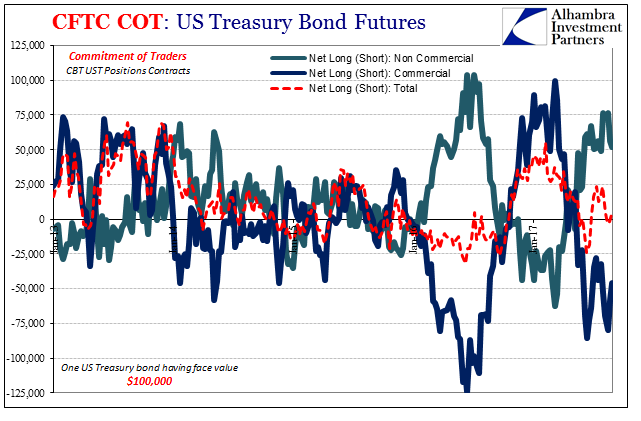 - Click to enlarge |
Tags: Bonds,Commitment of Traders,commodities,COT,Crude Oil,currencies,economy,Federal Reserve/Monetary Policy,Futures market,Interest rates,Markets,newslettersent,oil prices,U.S. Treasuries,WTI,wti futures