


Jeffrey P. Snider
My articles My offerMy siteAbout meMy videosMy books
Follow on:LinkedINTwitterSeeking Alpha
| The National Association of Realtors (NAR) reported today that sales of existing homes (resales) were up slightly in September 2017 on a monthly basis. At a seasonally-adjusted annual rate of 5.39 million last month, that was practically unchanged from the 5.35 million estimate for August that was the lowest in a year.
On an annual basis, resales in September were 1.5% less than those in September 2016. It was the first contraction for existing home sales since July 2016. |
US Existing Home Sales, Jan 2011 - Jul 2017(see more posts on U.S. Existing Home Sales, )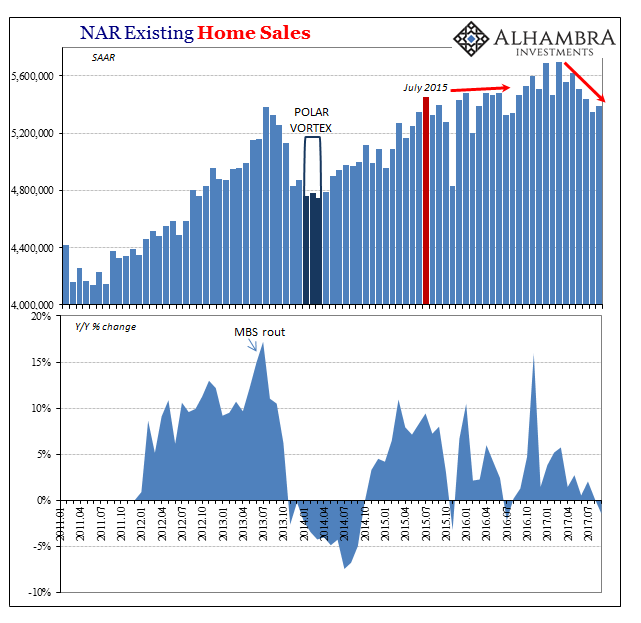 - Click to enlarge |
| There may be some storm effects to consider in these figures, but for yet another economic account softness, weakness, or however you wish to classify the trend started long before Harvey and Irma were superheated winds blowing across the Sahara. Perhaps some house closings were delayed in process by them, but the lack of significant rebound in September suggests underlying fundamentals rather than anything else. |
US Inventory of Homes for Sales, Feb 2013 - Aug 2017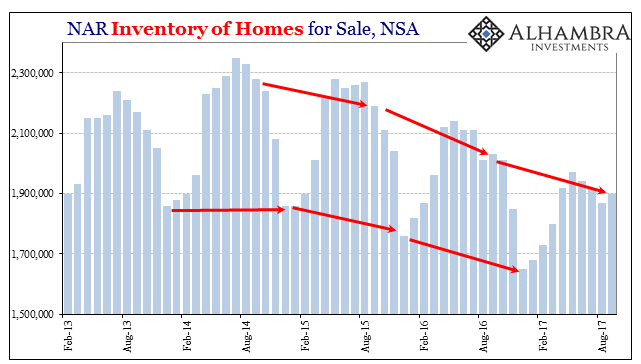 - Click to enlarge |
| Those fundamentals continue to be reluctance as a macro rather than financial or other matter. The level of estimated inventory of homes available for sale continues to shrink. The change in inventory, a proxy, really, of labor market confidence, dates back to right when you would expect – the middle of 2015 and the appearance of a serious slowdown that has yet to be reported in the mainstream (thus, it can’t be manipulated emotion as some economists like to claim). |
US Inventory of Homes for Sale, Feb 2014 - Sep 2017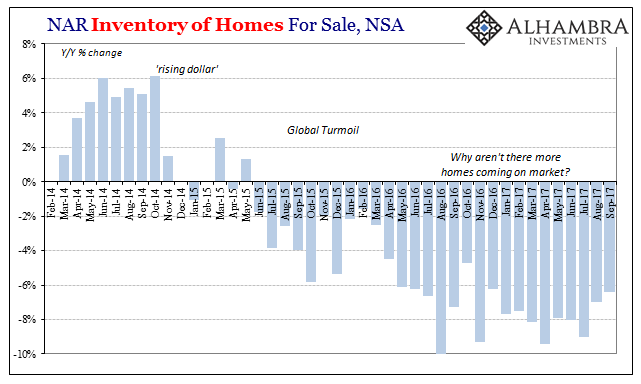 - Click to enlarge |
| As noted a few days ago in identifying the same sort of softness in especially apartment construction (as well as the timing), these inflections follow almost perfectly the deceleration in the labor market. |
US Housing Construction, Jan 2009 - 2017 - Click to enlarge |
| Again, the real estate equation is pretty simple; fewer new jobs, fewer new households (demand for new housing units) as well as fewer home owners willing to risk making a jump. |
US Establishment Survey, Jan 2010 - Jul 2017(see more posts on establishment survey, ) - Click to enlarge |
| The breakdown of the monthly resale volume leaves no doubt as to what is taking place in the market. The volume of sales at the lower ends is down; in the lowest tier by nearly 20% year-over-year. The $100k to $250k segment, which saw sales decline by nearly 6% in September 2017 from September 2016, accounted for 43% of all resales. Together with the bottom tier, the two form a small majority of all activity. |
US Existing Home Sales, Sep 2017(see more posts on U.S. Existing Home Sales, )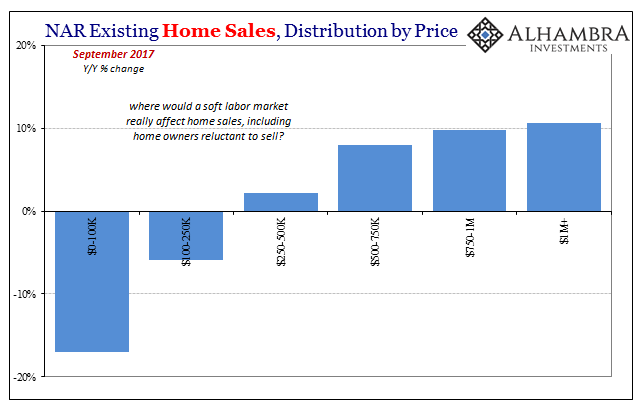 - Click to enlarge |
| In 2013-14, a similar skew (contraction in the lower price ranges) was to some degree attributable to lower sales of foreclosures (and short sales), the final remnants of housing bust imbalances being drawn off. It wasn’t solely related to that, as financing elements also came into play after the violent MBS rout of summer 2013 roiled mortgage markets and led many banks (including the largest mortgage company Wells Fargo) to scale back home lending.
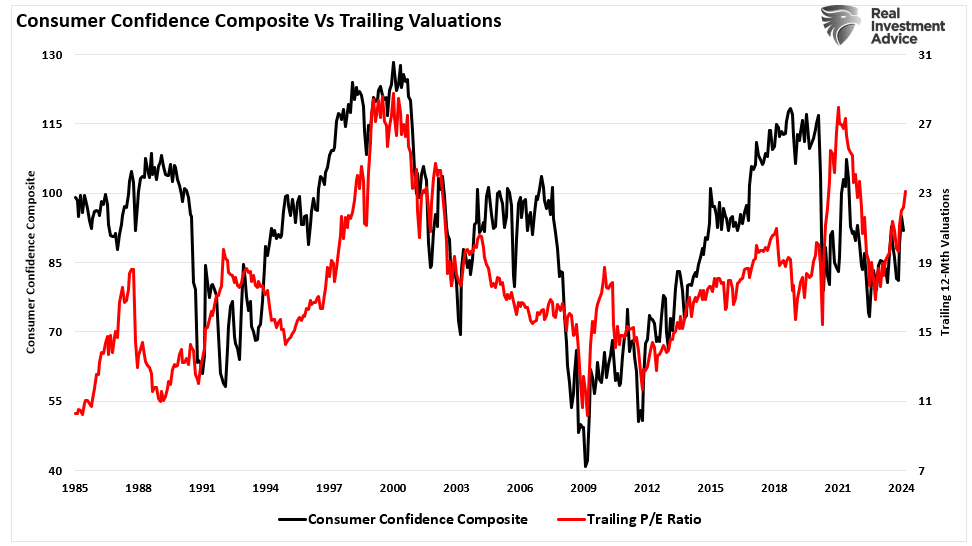
In 2017, there isn’t even those possibilities, meaning that people who own lower end homes are those who aren’t selling them (despite all incentives to do so, including the natural human instinct to move up when times are good). It leaves only the labor market and really broad perceptions about the labor market as it really is quite apart from the unemployment rate view of the economy. Sales at the upper ends aren’t as robust as they were, either, but it does once again propose rather stark economic disparity, the same bifurcation that has been evident since the Great “Recession.” The lack of economic recovery is not universal (no recovery really is), and has hit those “at the bottom” the hardest. In other words, some parts of the economy have recovered, and the people in those parts are acting like it (and probably wonder what all the fuss is about). It helps account for among other things further differences in trends like retail sales stagnation versus consumer confidence rising back to and even above pre-crisis highs. This is an economic problem as old as the Industrial Revolution. No economy will ever be perfectly equal, nor should we ever want it to be so compressed in that way (like feudalism). The difference in the 2010’s is displayed pretty clearly again here, though, meaning that the lack of full recovery has left far too much of a proportion (globally) at the wrong end to be healthy. The contraction in 2008-09 made that oversized proportion, but then the lack of growth thereafter has trapped those within it. An actually healthy economy is one where mobility is a two-way proposition – you might get knocked down by a recession or the like, but you can get right back up and climb the ladder again. That’s what keeps those outside to a small and manageable level. Economic dissatisfaction is almost always a function of perceptions about mobility (which affects more than the 15 or 16 million left out of the official labor force). What’s worse, the proportion of Americans fearing the wrong direction of economic mobility appears to be growing (more people sensing less opportunity and greater risk of falling, therefore unwilling to sell their homes as well as a whole bunch of other negative factors that don’t show up so easily in economic statistics) as the gap between actual economic output and what is badly needed recovery only grows larger. It becomes a self-reinforcing problem starting in the labor market and working outward (auto sales being another good indication). |
US Real Gross Domestic Product, Jan 1993 - 2017(see more posts on U.S. Gross Domestic Product, )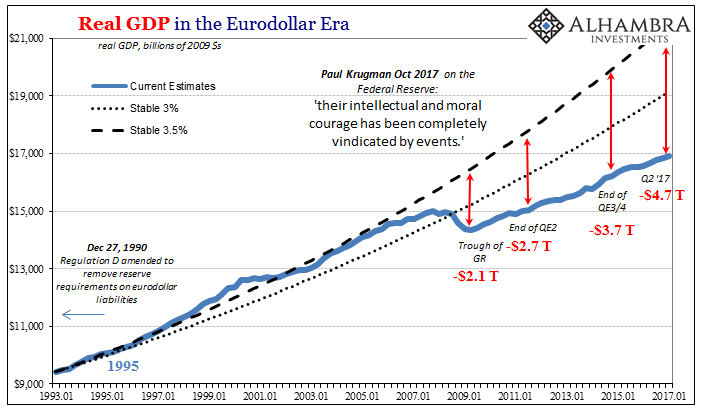 - Click to enlarge |
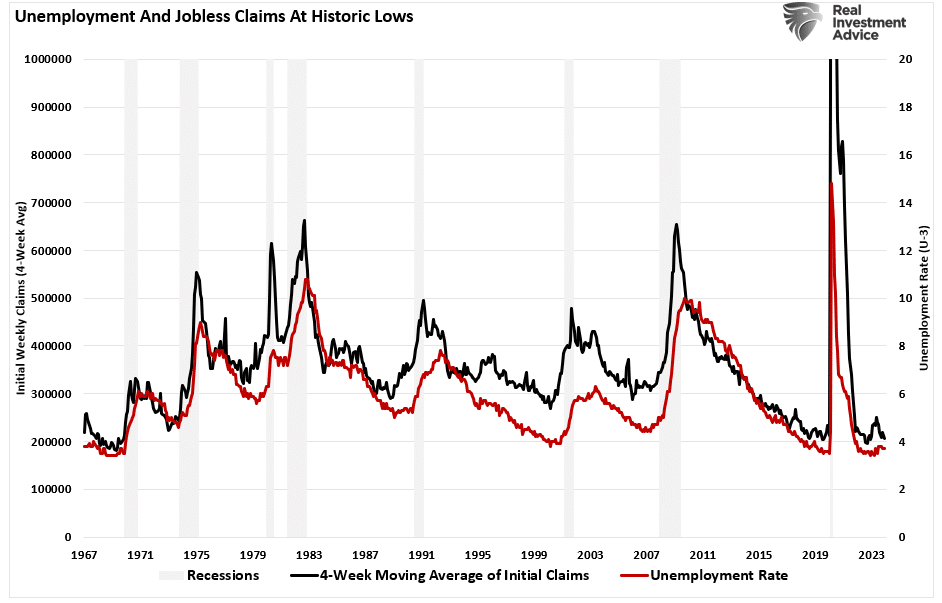
| They always say that action speaks louder than words. Here we see pretty clearly consumers in action, when economists like Janet Yellen are instead focused on the words of the unemployment rate. That’s why they missed the near-recession in 2015-16 (how bad does that “rate hike” in December 2015 look in hindsight; totally clueless) and why they continue to miss the after-effects from it. |
U.S. Real Personal Income, Jan 2010 - Jul 2017(see more posts on U.S. Personal Income, ) - Click to enlarge |
Tags: Consumer Confidence,consumers,currencies,economy,establishment survey,Federal Reserve/Monetary Policy,incomes,Inventory,jobs,Labor Market,Markets,newslettersent,payrolls,resales,U.S. Existing Home Sales,U.S. Gross Domestic Product,U.S. Personal Income